ta code examples
0
Contents
This python code example will show you how to use the ta python package to perform technical analysis on historical stock data such as RSI, SMA, Bollinger Bands, and Stochastic Oscillator.
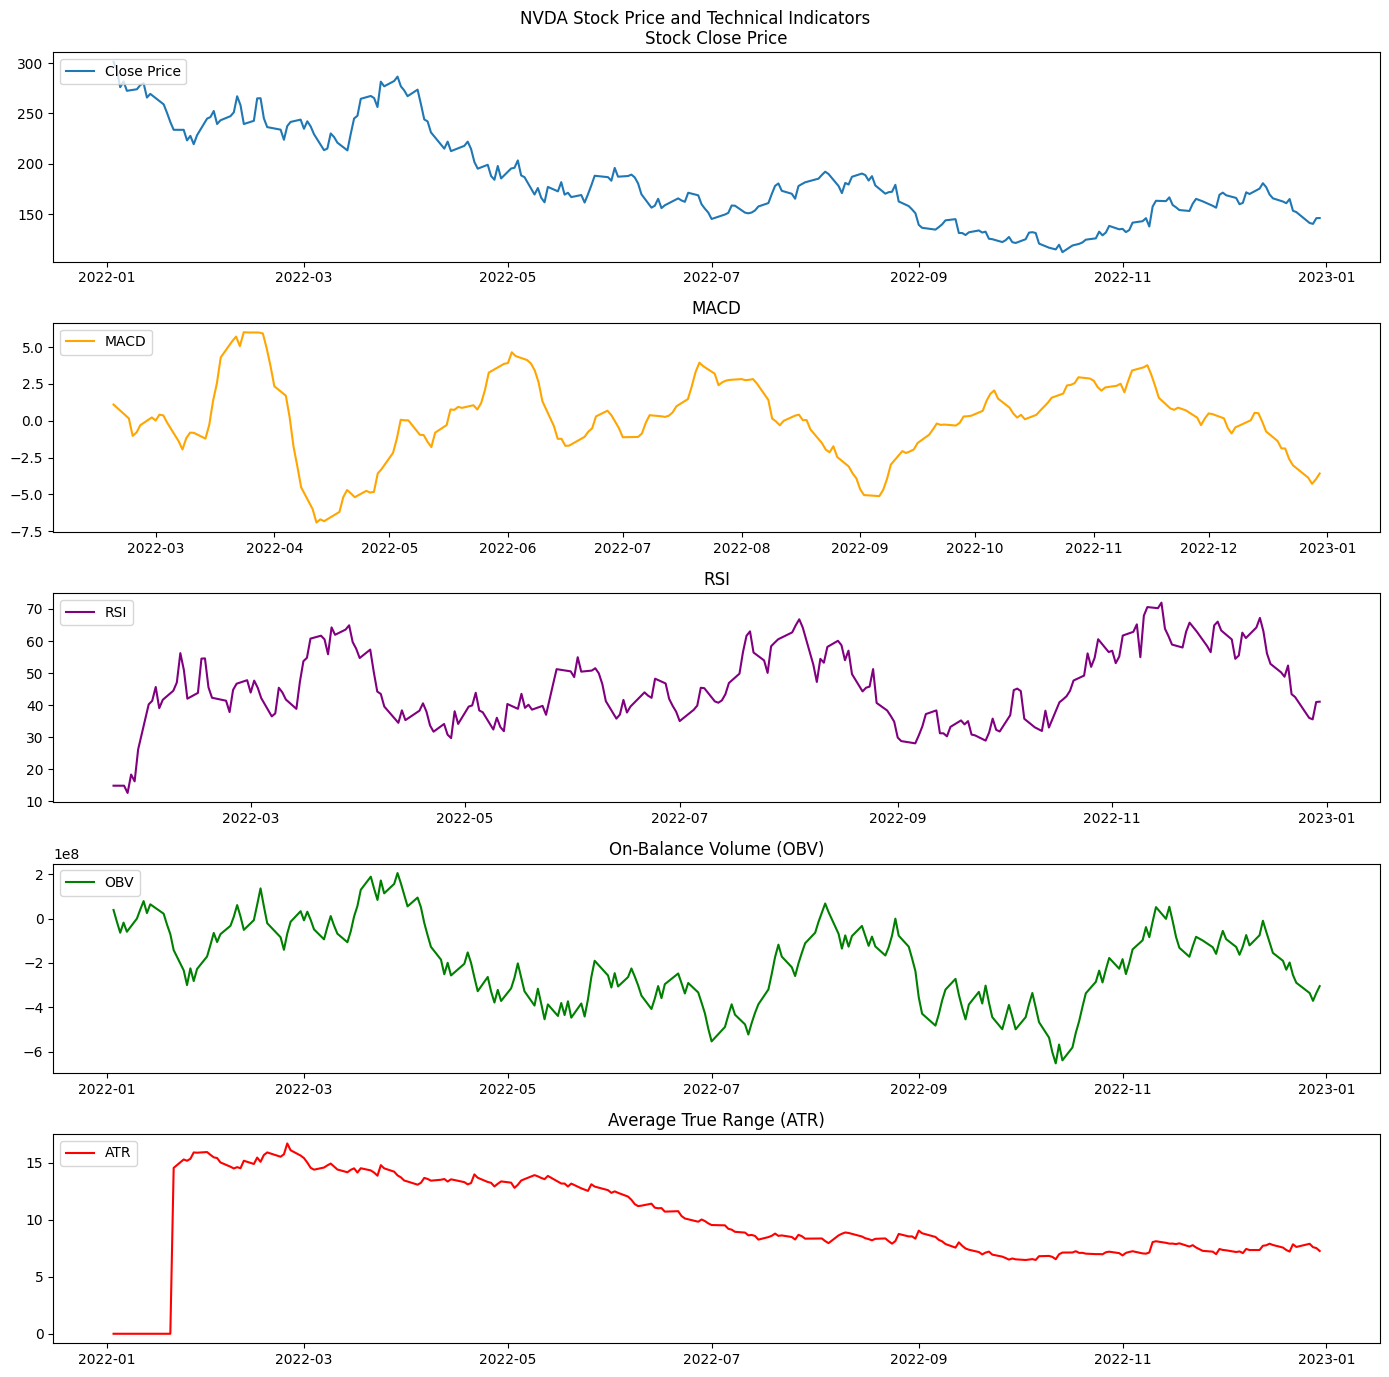
The code uses yfinance to download 12 months of price data for Nvidia (NVDA) and then calculates each of the technical analysis indicators using the ta library. Finally, the code example uses matplotlib to plot all of the data.
Source Code
# Import necessary libraries
import yfinance as yf
import ta
import matplotlib.pyplot as plt

# Download historical data for desired ticker symbol
df = yf.download('NVDA', start='2022-01-01', end='2023-01-01')

# Calculate Simple Moving Average (SMA)
df['SMA'] = ta.trend.sma_indicator(df['Close'], window=14)

# Calculate Exponential Moving Average (EMA)
df['EMA'] = ta.trend.ema_indicator(df['Close'], window=14)

# Calculate Moving Average Convergence Divergence (MACD)
df['MACD'] = ta.trend.macd_diff(df['Close'])

# Calculate Relative Strength Index (RSI)
df['RSI'] = ta.momentum.rsi(df['Close'], window=14)

# Calculate Bollinger Bands
df['BB_High'] = ta.volatility.bollinger_hband(df['Close'])
df['BB_Low'] = ta.volatility.bollinger_lband(df['Close'])

# Calculate On-Balance Volume (OBV)
df['OBV'] = ta.volume.on_balance_volume(df['Close'], df['Volume'])

# Calculate Money Flow Index (MFI)
df['MFI'] = ta.volume.money_flow_index(df['High'], df['Low'], df['Close'], df['Volume'])

# Calculate Stochastic Oscillator
df['Stochastic_Oscillator'] = ta.momentum.stoch(df['High'], df['Low'], df['Close'])

# Calculate Average True Range (ATR)
df['ATR'] = ta.volatility.average_true_range(df['High'], df['Low'], df['Close'])

# Plotting
fig, axs = plt.subplots(5, figsize=(14, 14))
fig.suptitle('NVDA Stock Price and Technical Indicators')

# Plot stock close price
axs[0].plot(df.index, df['Close'], label='Close Price')
axs[0].set_title('Stock Close Price')
axs[0].legend(loc='upper left')

# Plot MACD
axs[1].plot(df.index, df['MACD'], label='MACD', color='orange')
axs[1].set_title('MACD')
axs[1].legend(loc='upper left')

# Plot RSI
axs[2].plot(df.index, df['RSI'], label='RSI', color='purple')
axs[2].set_title('RSI')
axs[2].legend(loc='upper left')

# Plot OBV
axs[3].plot(df.index, df['OBV'], label='OBV', color='green')
axs[3].set_title('On-Balance Volume (OBV)')
axs[3].legend(loc='upper left')

# Plot ATR
axs[4].plot(df.index, df['ATR'], label='ATR', color='red')
axs[4].set_title('Average True Range (ATR)')
axs[4].legend(loc='upper left')

# Show the plot
plt.tight_layout()
plt.show()
Output Plot

With just a few lines of code, we can fetch historical stock data, calculate technical indicators, and visualize the results, making it an invaluable tool for financial analysts and algorithmic traders alike.
About ta
ta - A Technical Analysis Library in Python.
 pythonfix