Use pandas and matplotlib to produce a chart of natural gas prices
0
Contents
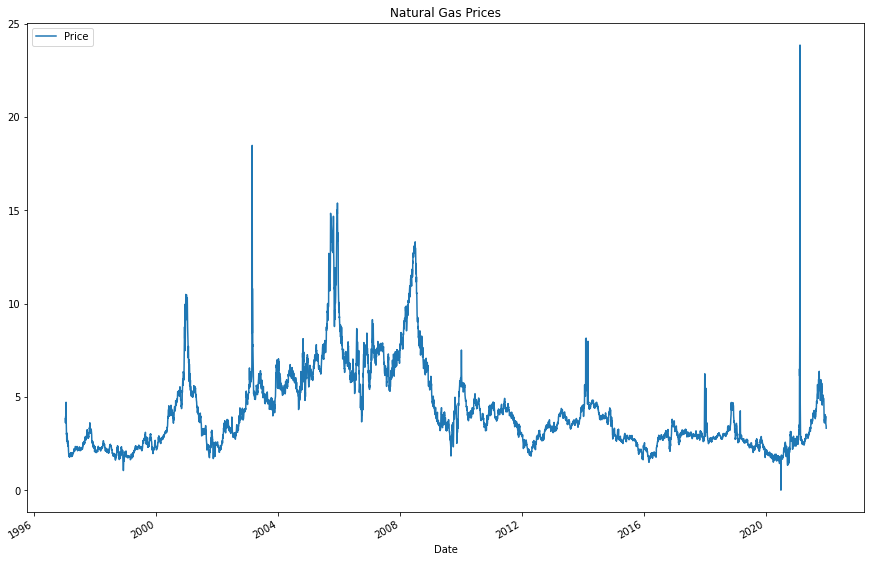
In this example Python code, we use requests to fetch data from the EIA.gov website and json from the Python standard library to parse the json data. Next, we load the daily prices into a Pandas DataFrame and format the date column and set it as the index. Finally, we use Pandas .plot() to create a chart saving it as a png image.
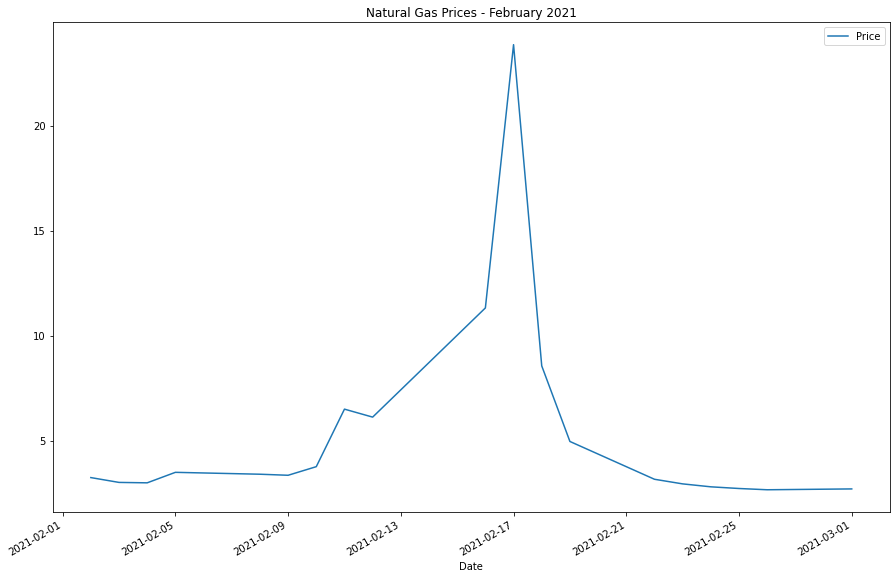
Additionally, we use date slicing to generate a 1 month chart of February 2021 showing the price spike experienced during winter storm Uri.
import json
from rich import print
import pandas as pd
import requests

API_KEY = "YOUR_API_KEY"
url = f"https://api.eia.gov/series/?api_key={API_KEY}&series_id=NG.RNGWHHD.D"

resp = requests.get(url)
natgasdata= resp.json()
df = pd.DataFrame(natgasdata["series"][0]["data"], columns=["Date", "Price"])
df['Date'] = pd.to_datetime(df['Date'].astype(str), format='%Y%m%d')
df.set_index('Date', inplace=True)

df.plot(
    y = 'Price', figsize=(15,10), title="Natural Gas Prices"
)
    .get_figure()
    .savefig('natural-gas-prices.png')

df['2021-02-01':'2021-03-01'].plot(
    y = 'Price', figsize=(15,10), title="Natural Gas Prices - February 2021"
)
    .get_figure()
    .savefig('natural-gas-prices-feb2021.png')
Module Imports
import json
from rich import print
import pandas as pd
import requests
Fetch Price Data
API_KEY = "YOUR_API_KEY" # Obtain API Key at https://www.eia.gov/opendata/register.php
url = f"https://api.eia.gov/series/?api_key={API_KEY}&series_id=NG.RNGWHHD.D"

resp = requests.get(url)
natgasdata= resp.json()
Create DataFrame
df = pd.DataFrame(natgasdata["series"][0]["data"], columns=["Date", "Price"])
df
| Date | Price | |
|---|---|---|
| 0 | 20211228 | 3.32 |
| 1 | 20211227 | 3.45 |
| 2 | 20211223 | 3.56 |
| 3 | 20211222 | 3.95 |
| 4 | 20211221 | 3.96 |
| ... | ... | ... |
| 6290 | 19970113 | 4.00 |
| 6291 | 19970110 | 3.92 |
| 6292 | 19970109 | 3.61 |
| 6293 | 19970108 | 3.80 |
| 6294 | 19970107 | 3.82 |
6295 rows × 2 columns
Transform DataFrame
Convert the Data column type from a string into a datetime and then set the Date column as the index.
df['Date'] = pd.to_datetime(df['Date'].astype(str), format='%Y%m%d')
df.set_index('Date', inplace=True)
df
| Price | |
|---|---|
| Date | |
| 2021-12-28 | 3.32 |
| 2021-12-27 | 3.45 |
| 2021-12-23 | 3.56 |
| 2021-12-22 | 3.95 |
| 2021-12-21 | 3.96 |
| ... | ... |
| 1997-01-13 | 4.00 |
| 1997-01-10 | 3.92 |
| 1997-01-09 | 3.61 |
| 1997-01-08 | 3.80 |
| 1997-01-07 | 3.82 |
6295 rows × 1 columns
Plot the chart
df.plot( y = 'Price', figsize=(15,10), title="Natural Gas Prices")

Generate a 1 month chart of February 2021 showing the price spike experinced during winter storm Uri.
df['2021-02-01':'2021-03-01'].plot( y = 'Price', figsize=(15,10), title="Natural Gas Prices - February 2021")

 pythonfix